The Secret Behind Bearish Trend Reversals

Learn Forex Trading
Traders looking to enter the market are often sent off on a journey to discover the ‘holy grail’ of market entries. They study numerous theories; Japanese candlestick reversals, contrarian theory, oscillator divergence, wave theory, and others. Traders who are just starting out, put their trust in indicators and oscillators and rely on them make the decisions on when to place an order – and the more indicators/oscillators they discover, the more they add into their strategy.
The most neglected indicator/oscillator is price. That’s right, price! Price is superior to any indicator and all others come second. It’s the only indicator that encompasses everything – economic factors, political and geographical. Novice traders often do not understand the importance of price and most of the time, they don’t give it the attention it deserves.
The most effective market entry is trend reversal. After an ongoing trend towards one direction, the market eventually signals the end of that trend and begins a new one towards the opposite direction. In this article, we’ll be focussing on a few of the most popular reversal patterns: head & shoulders, double top and triple top.
Head & Shoulders
Head & Shoulders have a reputation for being one of the most dependable reversal patterns. It’s a pattern based on price movement and indicates the start of a new trend in one direction, after an ongoing trend in the other direction ends.
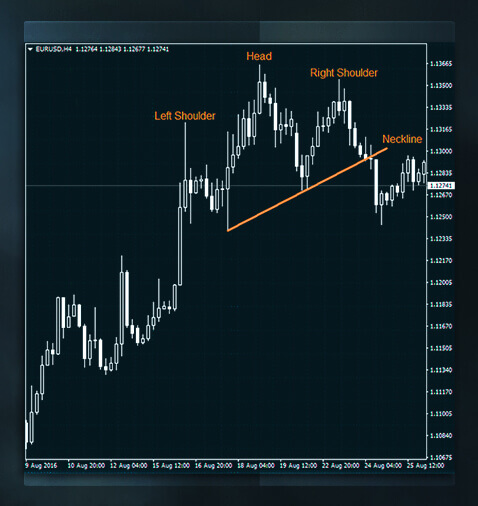
How to spot Head & Shoulders:
- To have a reversal, an existing trend needs to exist, and head & shoulders is no different.
- A prevailing uptrend (in this case) is made up of consequent higher tops and bottoms.
- If volume is available, it signals alerts.
- An upwards move to the Head often illustrates decreased volume (if available) and signals a warning.
- The right Shoulder is lower than the Head and indicates a potential reversal.
- A significant close below the neckline (with increased volume, if available) indicates the end of the uptrend and the start of a downtrend.
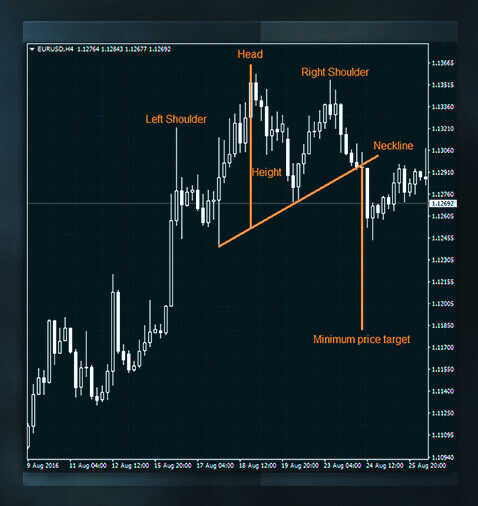
- To calculate the minimum price target, project the height of the pattern to the neckline’s breakout point.
Triple Tops
Similar to the Head & Shoulders, the Triple Top is made up of three (almost) equal tops and a significant close below the support (bottom) of the formation. It’s important to have a break below the bottom in order to have a valid Triple Tops. The three tops on their own are not enough!
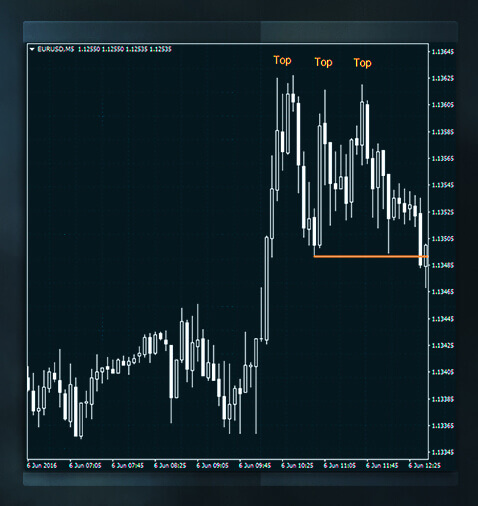
How to spot Triple Tops:
- An existing trend (in this case an uptrend) is vital before you go looking for a reversal.
- As with Head & Shoulders, the existing trend is marked by its consecutive higher tops and bottoms.
- If volume is available, it signals alerts.
- The upwards move to the resistance area indicates decreased volume (if available) and signals weakness to move higher.
- Equal (or almost equal) tops make up the resistance area.
- A significant close below the bottom (with increased volume, if available) indicates the end of the uptrend and the start of a downtrend.
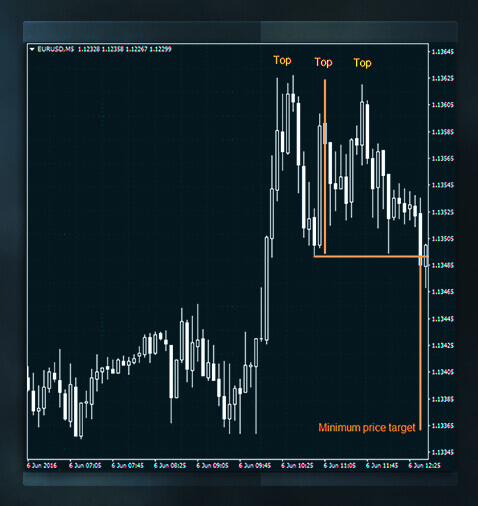
- To calculate the minimum price target, project the height of the pattern to the breakout point.
Double Tops
During an uptrend, a top might surpass a previous top if the demand exceeds the supply. When that trend runs out of gas, it will start showing signs (signals) of weakness. If volume is available, then a decrease in it will be the first signal as it moves upwards. Another signal is if the last top fails to go higher than the previous one. A reversal is confirmed if prices break below the bottom/support area.
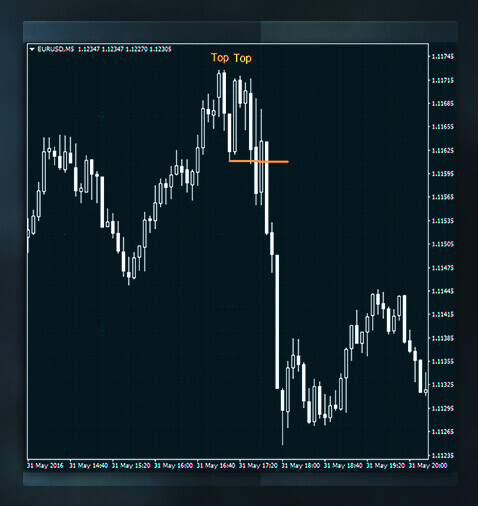
How to spot Double Tops:
- An existing trend (in this case uptrend) is necessary.
- The existing uptrend is defined by consecutive higher tops and bottoms.
- If volume is available, it signals alerts.
- The upwards move to the resistance area indicates decreased volume (if available) and signals weakness to move higher.
- The tops are equal (or almost).
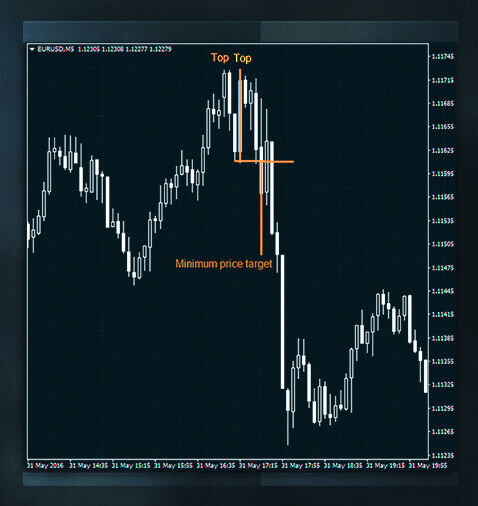
- A significant close below the bottom (with increased volume, if available) indicates the end of the uptrend and the start of a downtrend.
- To calculate the minimum price target, project the height of the pattern to the breakout point.
Price rules supreme over oscillators and indicators. Price discounts for everything that affects the markets and reveals the crowd’s (traders) psychology. There are many bearish or bullish trend reversal patterns, and traders should pay more attention to them rather than experimenting solely with candlestick reversals and oscillator signals. Available volume in combination with oscillator analysis, can confirm reversal patterns with higher potential accuracy.
Disclaimer: This written/visual material is comprised of personal opinions and ideas. The content should not be construed as containing any type of investment advice and/or a solicitation for any transactions. It does not imply an obligation to purchase investment services, nor does it guarantee or predict future performance. FXTM, its affiliates, agents, directors, officers or employees do not guarantee the accuracy, validity, timeliness or completeness of any information or data made available and assume no liability for any loss arising from any investment based on the same.
Risk Warning: There is a high level of risk involved with trading leveraged products such as forex and CFDs. You should not risk more than you can afford to lose, it is possible that you may lose more than your initial investment. You should not trade unless you fully understand the true extent of your exposure to the risk of loss. When trading, you must always take into consideration your level of experience. If the risks involved seem unclear to you, please seek independent financial advice.
